Demand forecasting with AI: how much stock and how many people you will need.
Models that learn from your history, your customers and the calendar to anticipate workload, inventory and shifts.
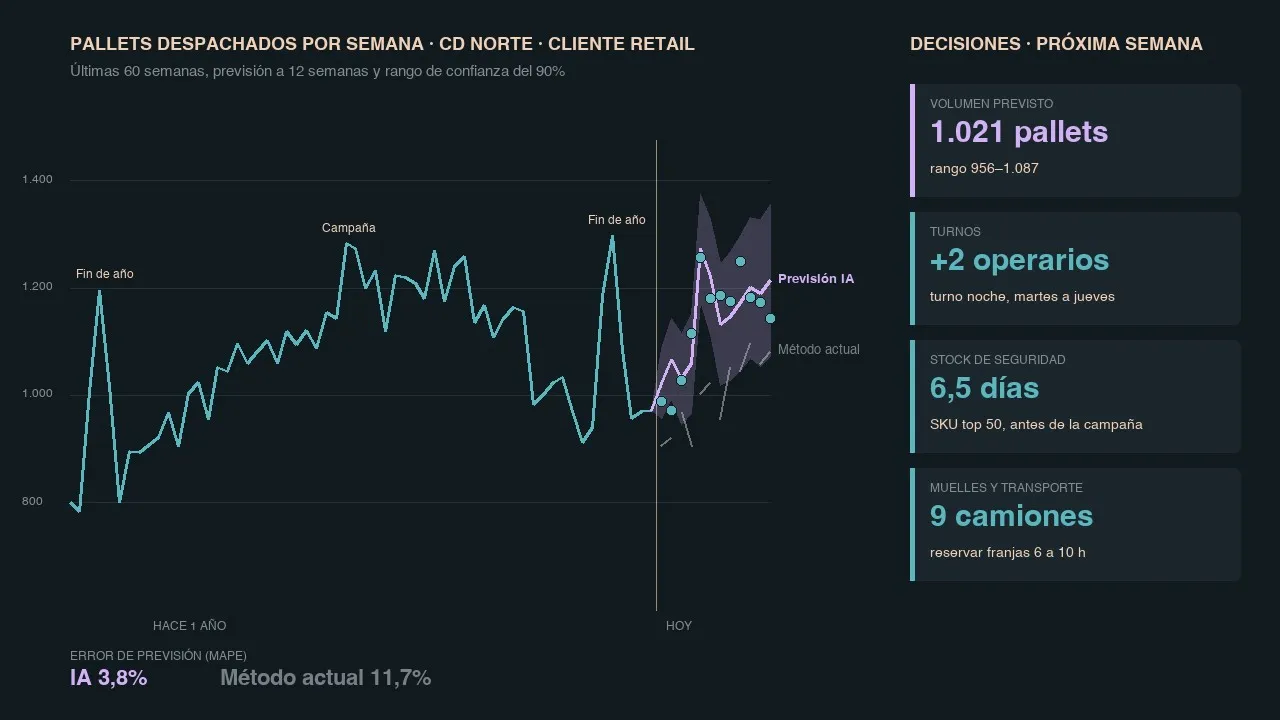
- 01Anticipates volume by customer, SKU, warehouse and day.
- 02Turns the forecast into decisions: stock, shifts, docks and transport.
- 03A good model also shows its uncertainty, not just a number.
The problem
Most operations plan with last year’s average and the gut feel of whoever knows the customers. It works until something changes: a campaign, a new customer, a stockout.
Time series models combine history, seasonality and external signals to estimate what is coming, with a confidence range that helps you decide.
From history to next week, with its margin of error.
- 01 · HistoryOrders, movements and dispatches for each week, cleaned and consolidated.
- 02 · ForecastThe model projects the coming weeks from patterns and seasonality.
- 03 · RangeEach forecast comes with a high and a low so you can plan with a margin.
Where it applies
- Shift sizingHow many people per shift and area, well in advance.
- Inventory replenishmentReorder points and safety stock per SKU.
- Dock and transport capacityTruck booking and time slots.
- 3PL rates and contractsNegotiate with data on each customer’s expected volume.
The model is the easy part. The hard part is the operation.
- Data
- At least one or two years of daily or weekly history, by customer or SKU.
- Integration
- Automatic reads from ERP and WMS, and output into planning.
- External signals
- Calendar, promotions, holidays and what sales already knows.
- Follow-up
- Measure forecast error every week and tune the model.
What we build it with
- NixtlaTime series
- scikit-learnClassical models
- DatabricksData and training
- GrafanaDashboards and monitoring
- OdooCore system
Reference tools. On each project we choose based on the architecture and systems the company already runs.
That is normal. Part of the work is consolidating and cleaning the history. Often that tidy-up already creates value before any model.
Usually weekly or daily, automatically, as new data comes in.
It depends on the business. What matters is measuring the error, comparing it with your current method and using the confidence range to decide.