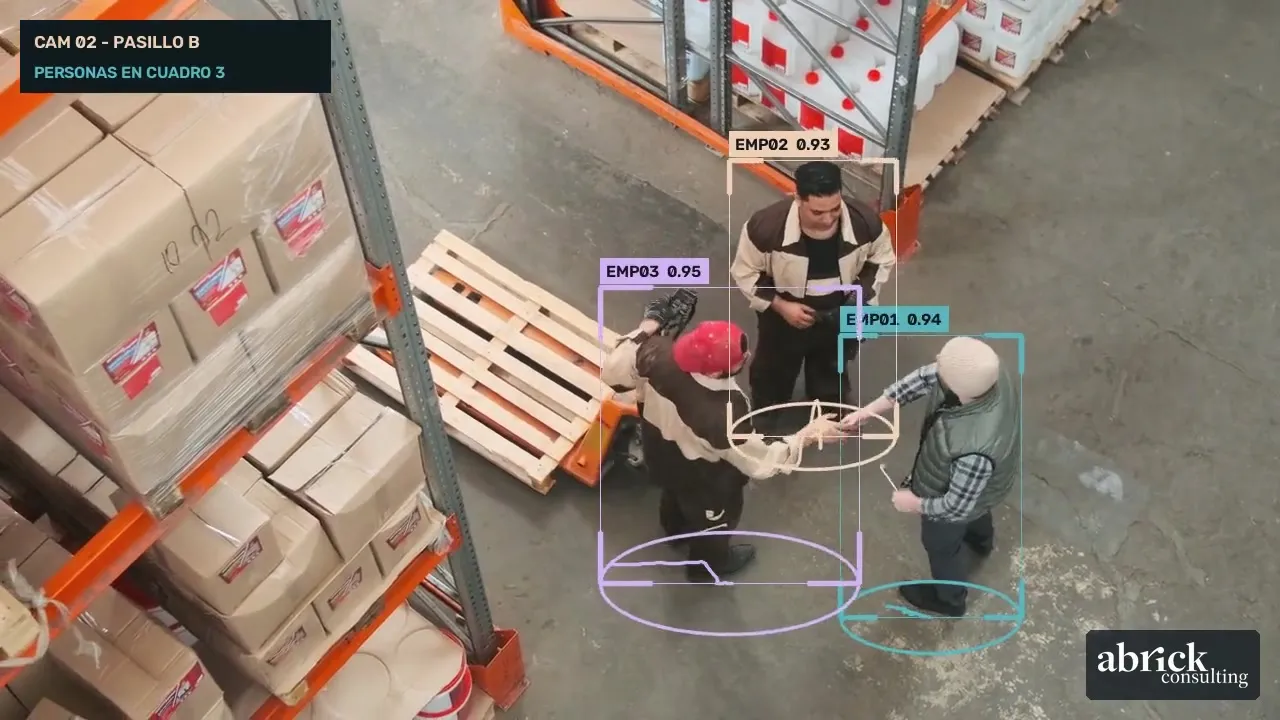
Anomaly detection: the odd stuff shows up before it costs you.
Models that learn what is normal in your inventory, costs and movements, and flag whatever falls outside the pattern.
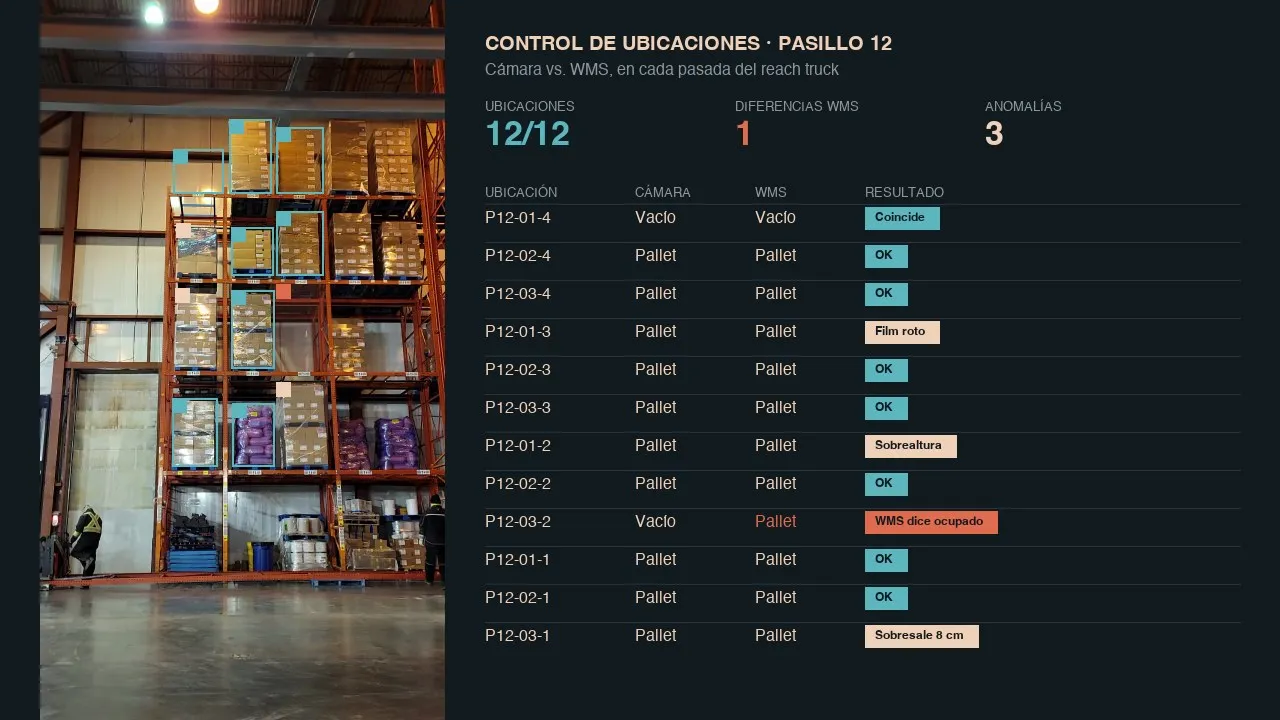
The essentials
- 01Detects inventory errors, cost deviations and possible fraud.
- 02No need to know in advance what to look for.
- 03Cuts manual review down to the cases that really matter.
The problem
Inventory discrepancies, overbilled freight and off-hours movements usually surface in an audit, months later.
An anomaly model learns the normal behavior of each location, customer or supplier and alerts you when something drifts.
How it works
Anomaly detection · PyOD, Isolation ForestThe scanner sweeps through. Anything abnormal gets flagged.
- 01 · NormalThe model learns the usual range for each location and movement.
- 02 · SweepEvery day, all the data is checked against that pattern.
- 03 · AlertAnything outside the range is flagged for review.
In operations
Where it applies
- InventoryStock differences, inconsistent locations, shrinkage.
- Freight billingCharges outside the rate card, or duplicated.
- Fraud and securityUnusual movements by user, time or zone.
- Operational deviationsAtypical productivity, cycle times or consumption.
What it takes
The model is the easy part. The hard part is the operation.
- Data
- Movements, inventories and billing with enough history.
- Thresholds
- Agree with the business how sensitive the model should be.
- Review flow
- Who investigates each alert and how it is logged.
- Integration
- WMS, ERP and billing systems.
Technology
What we build it with
Model
- PyODAnomalies
- scikit-learnClassical models
Infrastructure
- Apache AirflowData pipelines
Integration
- PostgreSQLOperational data
- GrafanaDashboards and monitoring
Reference tools. On each project we choose based on the architecture and systems the company already runs.
FAQ
It is calibrated so the team can actually review them. Better few and relevant.
Not necessarily. The model learns what is normal and points out what is different.
Daily or in real time, depending on the case.